A deep learning framework to estimate species diversity
Global biodiversity is currently under threat. Today, an estimated 1 million species are threatened with extinction. Reliable maps of species richness are crucial in targeting conversation efforts towards areas under threat.
Biogeographical research, the study of spatial patterns of species diversity and richness, has a long history. Early efforts considered, for example, measuring the uneven distribution of species diversity across regions, the notable increase in diversity from the poles to the equator, and large differences in species richness between certain habitat types (e.g. grassland vs. forests). These early works led to the formulation of measures for different levels of species diversity: alpha, beta, and gamma diversity Whittaker, 1960.
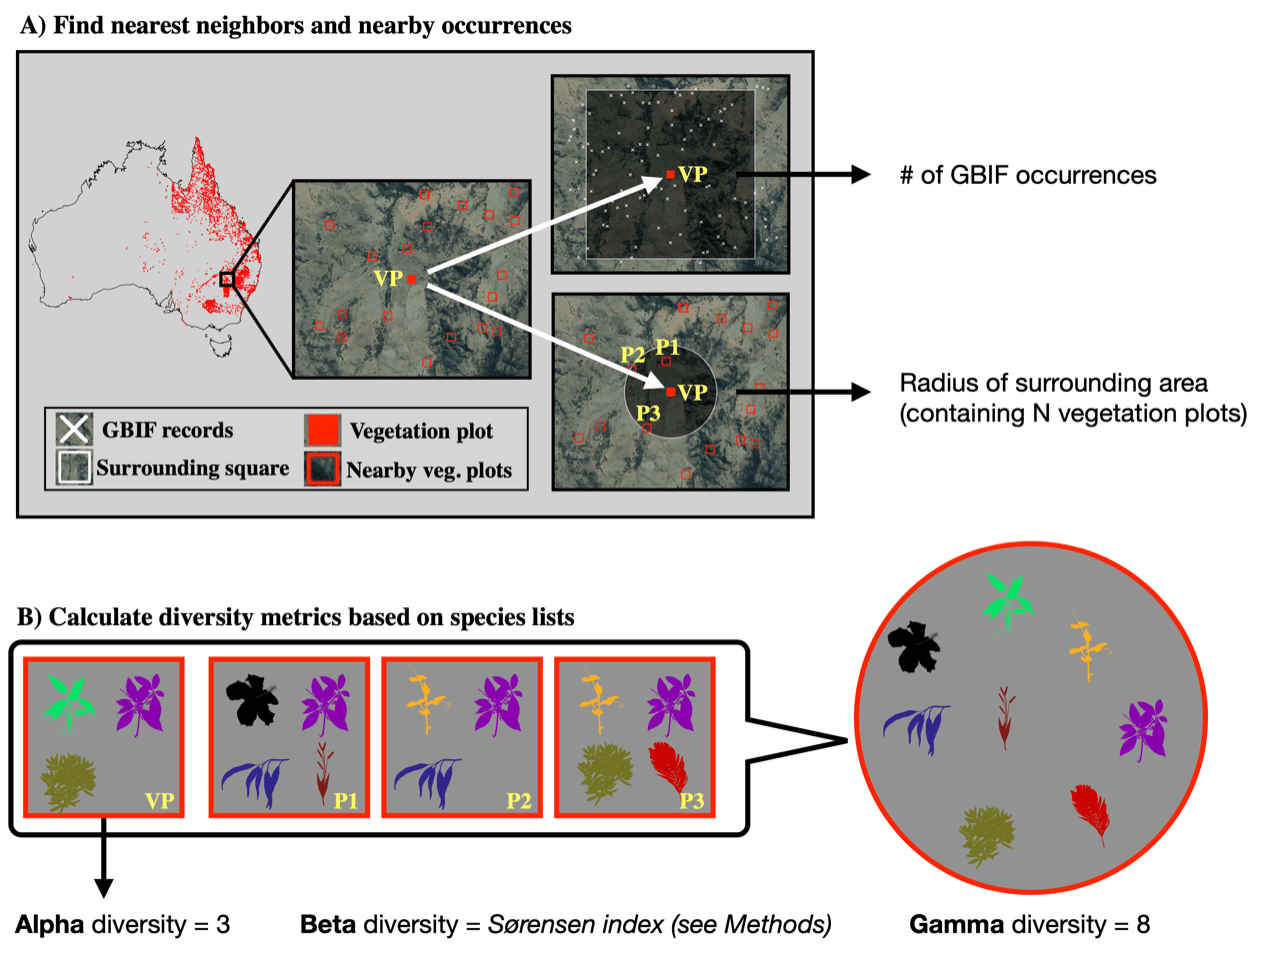
In brief, Alpha diversity refers to the diversity of species interacting with each other on a local scale, such as a plot or defined ecological unit, like a field. Beta diversity instead describes the difference in species diversity and composition between two patches (or species communities). Gamma diversity, by contrast, is a broad measure of the cumulative diversity of species in a larger area, for example, an ecoregion or country, independent of whether these species are ecologically interacting or not.
Classic manual species inventories in the field are commonly used to collect data on alpha diversity at various sites. However, it is not possible to scale-up such efforts to assess larger areas, or a whole continent. A number of different approaches are used to create diversity maps. In some cases, studies use simple cumulative counting of species presences from geographic occurrence records, floras, and checklists within a given area. In other cases, statistical modeling and estimations are used to derive cumulative diversity maps for larger areas. This may consist, for example, of estimating where individual species could potentially exist, based on what we know about their climatic and biotic preferences (species distribution modeling). However, there are shortcomings inherent to each of these methods. Most notably, approaches based on predictive methods can be biased if there are limited data available for certain species or taxa (taxonomic biases), whilst the approach of using occurrence records can be problematic if data coverage differs between areas (geographic biases).
Today, new deep learning methods, in combination with large data collection and databasing efforts, allow the combination of a multitude of datatypes and enable entirely new ways of addressing the challenge of modeling diversity. Big global databases are now available to provide point estimates of species diversity. These result from large-scale coordinated species inventories and provide excellent training data for deep learning approaches. A recent study by Večeřa et al. (2019) demonstrated how such information can be used in combination with machine learning methods to provide biodiversity predictions in European forests. However, to date, these approaches and data have only been applied for modeling alpha diversity, not addressing the species turnover between plots and the accumulation of species in larger geographic units.
In a recent publication, researchers from Gothenburg University, working alongside international collaborators, presented a deep learning framework using neural network models to predict alpha, beta, and gamma diversity (First author: Tobias Andermann, Gothenburg University, presently a DDLS fellow at Uppsala University. Corresponding authors: Alexandre Antonelli from Royal Kew Gardens in London, Russel R. Barret from University of Western Australia/Royal Botanic Gardens Sydney, and Daniele Silvestro from Gothenburg University/Fribourg University/Swiss Institute of Fribourg). Using a novel approach of processing data from sets of geographically linked species inventories, the network models were trained to predict plant diversity based on a number of spatial variables such as climatic and geographic predictors, human impact, and species records from online databases. The models were designed to largely avoid the biases of traditional approaches by skipping the step of having to model individual species distributions and instead modeling diversity as a feature of the landscape.
Australia was chosen to demonstrate the utility of the method due to the continents highly heterogenous diversity patterns. In brief, about 8000 vegetation plots were chosen and, for each of these, a list of plant species present in the plot were identified. Measures of the alpha, beta, and gamma diversity of vascular plants (Tracheophyta) were then compiled separately for each plot and used to train the models. Part of the vegetation plot data was used to assess the ability of the trained models to accurately predict diversity patterns. The results showed that the models yielded best results for gamma diversity (mean average percentage error = 6%). The trained model accurately identified multiple known biodiversity hotspots in Australia, showing that the model is able to identify areas of high species diversity at this scale. However, alpha and beta diversity were not estimated with the same accuracy, due to the inability of the model to learn small special differences from the climatic and geographic predictor data with limited spatial resolution.
“Using a combination of different publicly available data sources, we have produced a deep learning model that can predict the number of species that a given site can sustain, given the site’s geographic, climatic, and biotic features. Now we are working on making these models even more spatially explicit by using high-resolution remote sensing data, to be able to meaningfully model the biodiversity capacity on very local scales with a resolution of m2 instead of tens of km2. Such tools will be important when deciding on where to create protected areas or which sites to set aside for biodiversity offsets, using a fully data-driven approach.” says Tobias Andermann, first author of the study.
In summary, Andermann and colleagues presented a deep learning framework using neural network models as a viable new approach to estimate biodiversity patterns. This approach has several advantages, such as the use of different data inputs, as well as the ability to account for the effects of sampling efforts and human footprint features. Using plot-based Australian vegetation survey data, the researchers showed that the model could accurately identify levels of gamma biodiversity, and thus known biodiversity hotspots. These results indicate that deep learning methods have the potential to contribute towards automated biodiversity assessments, particularly for estimating the biodiversity capacity of a given site.
Data
-
Publicly available data sets were analysed in this study. The data used can be found on Zenodo.
-
All code related to the deep-learning framework is available on GitHub.
Article
Andermann, T., Antonelli, A., Barrett, R. L., Silvestro, D. (2022). Estimating alpha, beta, and gamma diversity through deep learning. Frontiers in Plant Science 13, 839407. https://doi.org/10.3389/fpls.2022.839407
Funding
This project was funded by a grant from the Swedish Research Council, The Swedish Foundation for Strategic Research, and the Royal Botanic Gardens, Kew, Swiss National Science Foundation. Computation was carried out on the Kebnekaise computing cluster, funded by the Swedish National Infrastructure for Computing (SNIC), the Kempe Foundations, and the Knut and Alice Wallenberg Foundation.